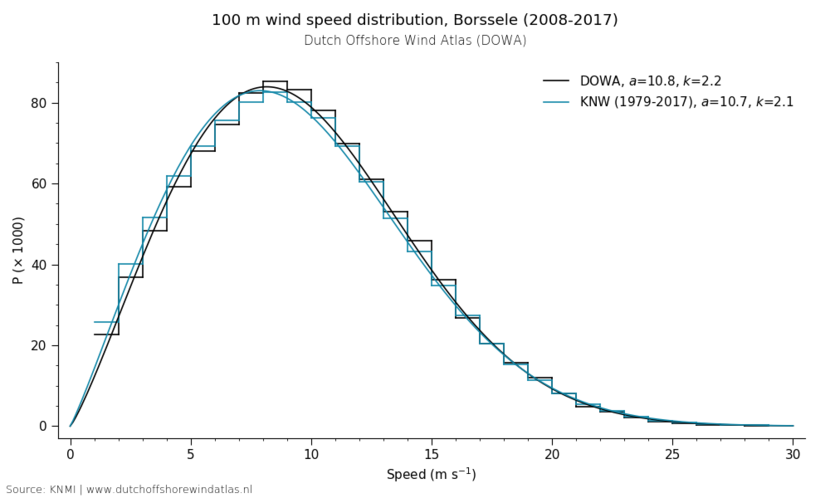
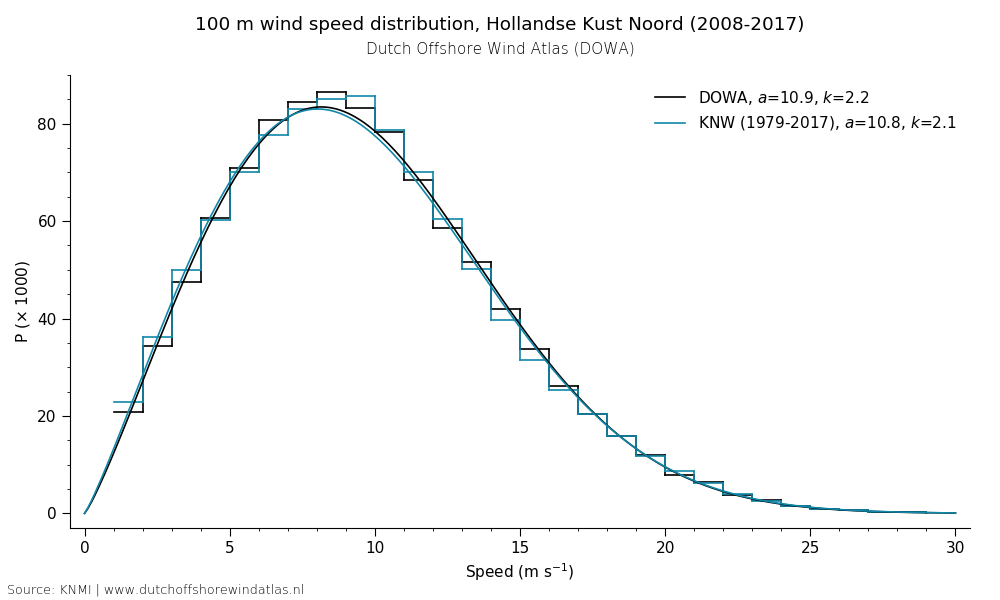
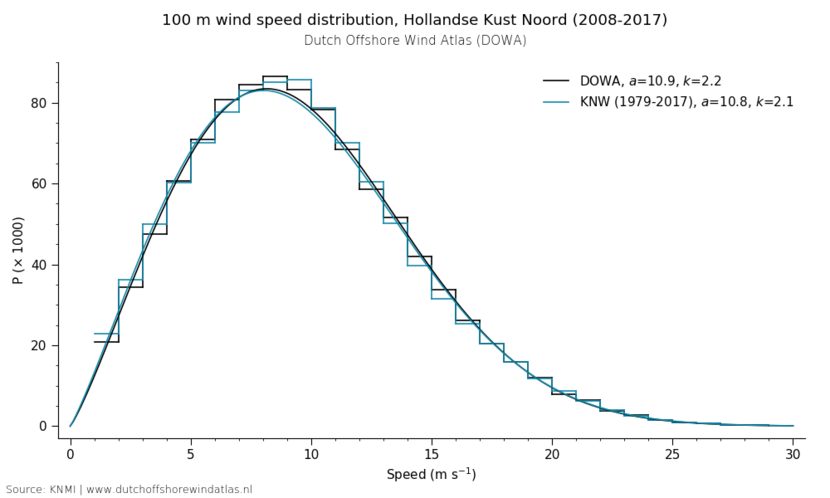
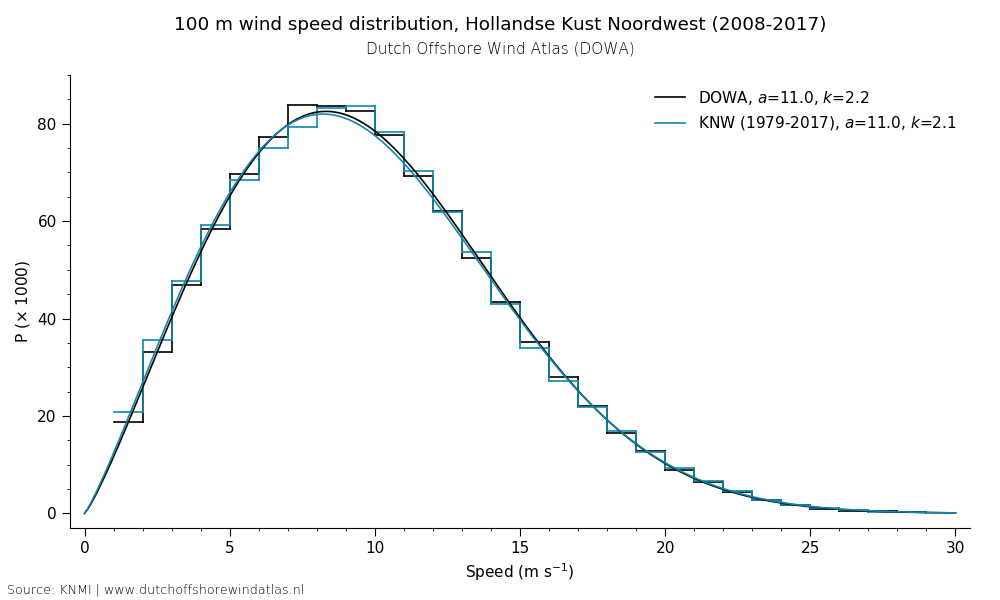
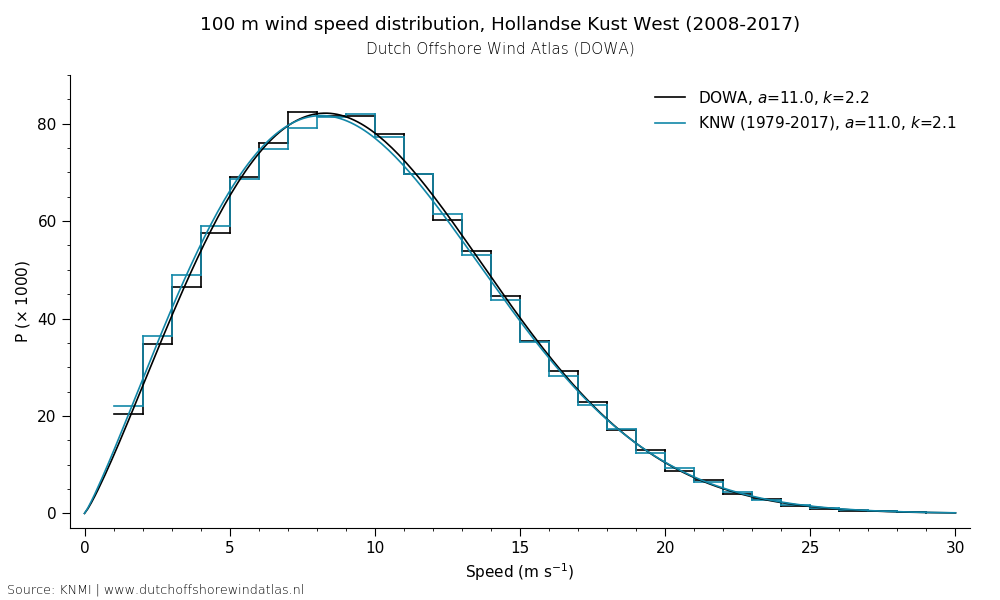
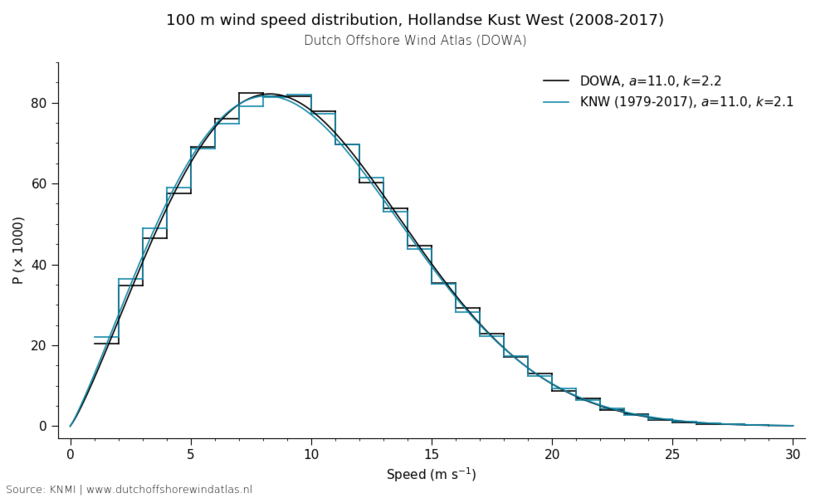
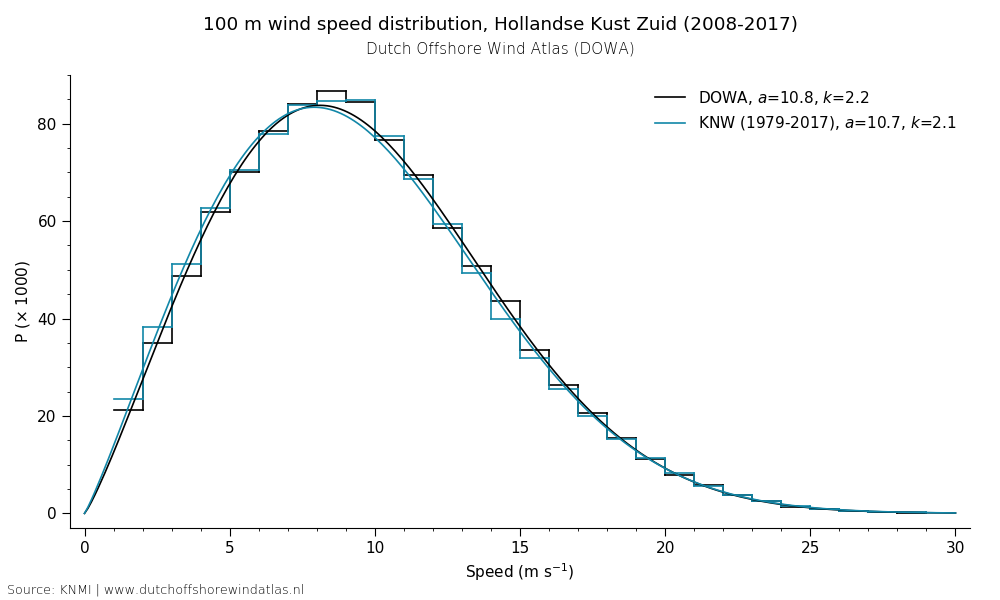
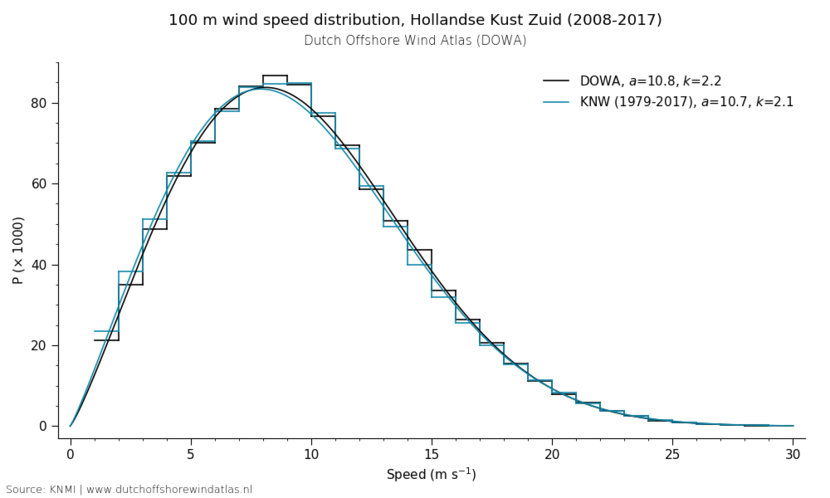
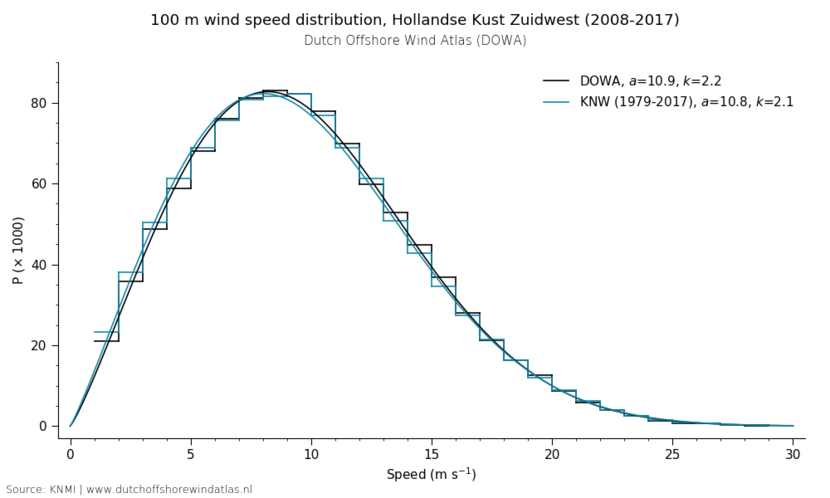
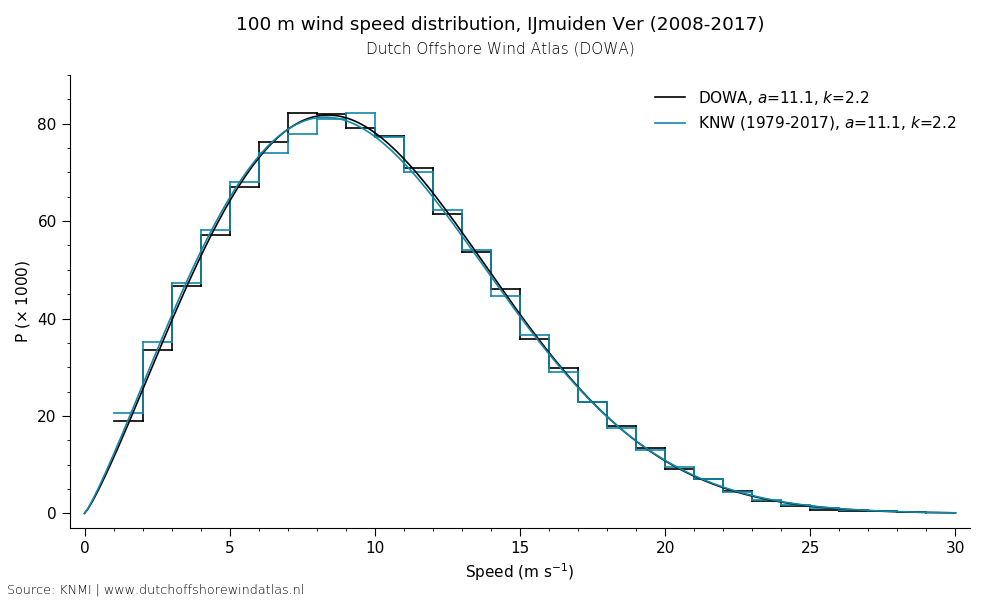
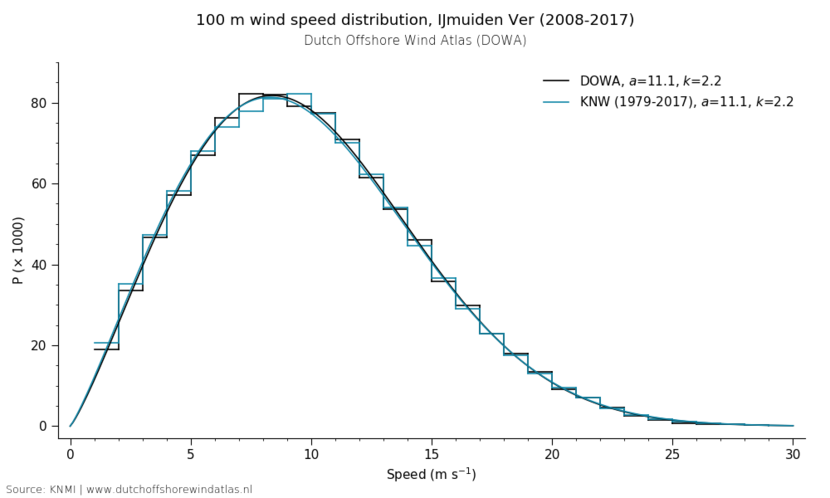
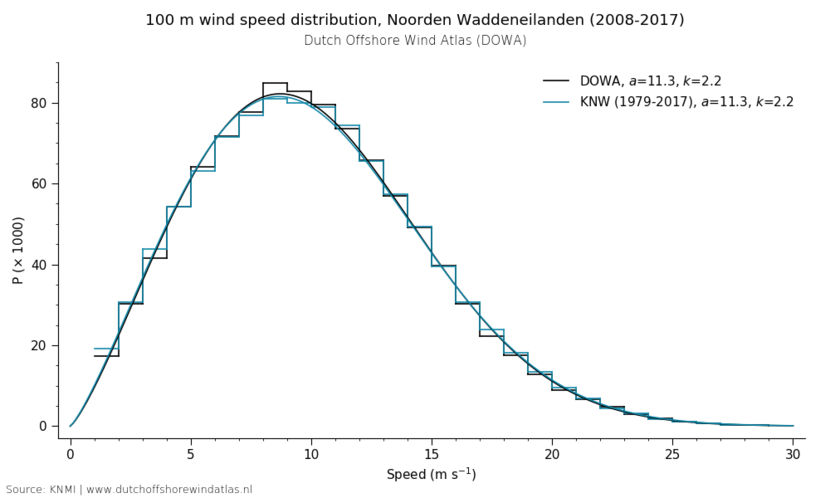
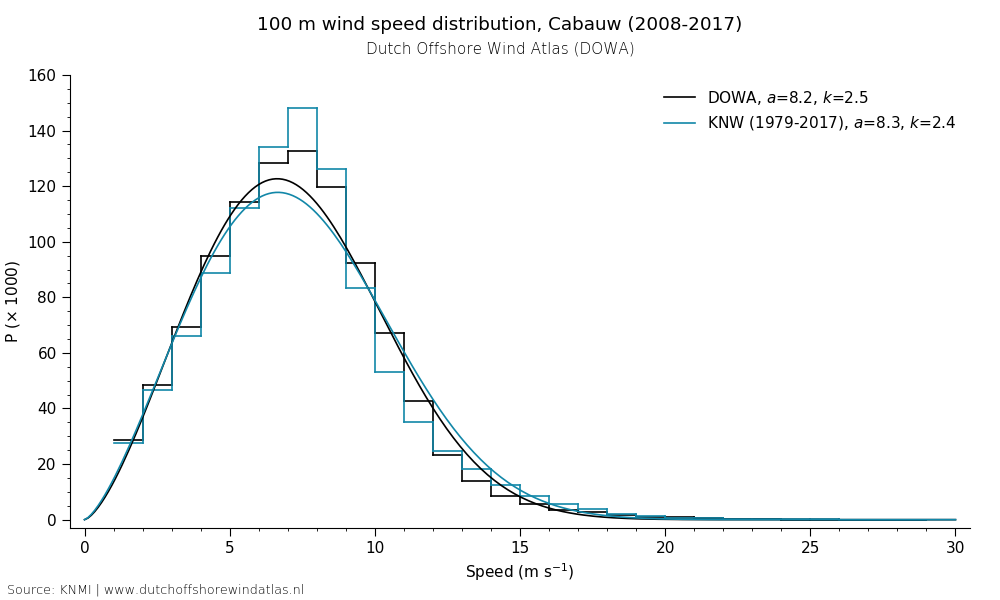
100 m wind speed distribution per wind farm zone and Cabauw
The frequency distributions presented here are all at 100 m height. It shows the wind speed frequency distribution and the corresponding Weibull fit based on the DOWA (2008-2017) in black and based on the KNW-atlas (1979-2017) in blue for comparison. The Weibull fit method described by Wieringa and Rijkoord (Wieringa J and Rijkoord PJ (1983) Windklimaat van Nederland. Staatsuitgeverij Den Haag, pp 263 - formula 5.18) was used to compute the Weibull-coefficients. This is a least squares fit of the linear relationship of formula 1 and when the left hand side is plotted against the natural logarithm of the wind speed (ln U), the gradient (k) and offset (k ln a) can be obtained and both Weibull parameters (k and a) can be quantified. Wind speed bins of 0.5 m/s from 4 m/s up to and including the bin containing the 99th percentile of the distribution were fitted. The graphs show 1.0 m/s bins to make them clearer.
formula 5.18:
ln( - ln [1 - F(U)]) = k(ln U) - k ln a
- F(U) is the cumulative Weibull distribution function which is the chance of exceeding the wind speed U
- k is the Weibull shape parameter
- a is the Weibull scale parameter