
100 m mean wind speed per wind farm zone and Cabauw
Wind speed: yearly and long-term averages and 10-year monthly and diurnal averages.
The figures presented here are all at a 100 m height. For each of the nine locations that you can select, there are three figures.
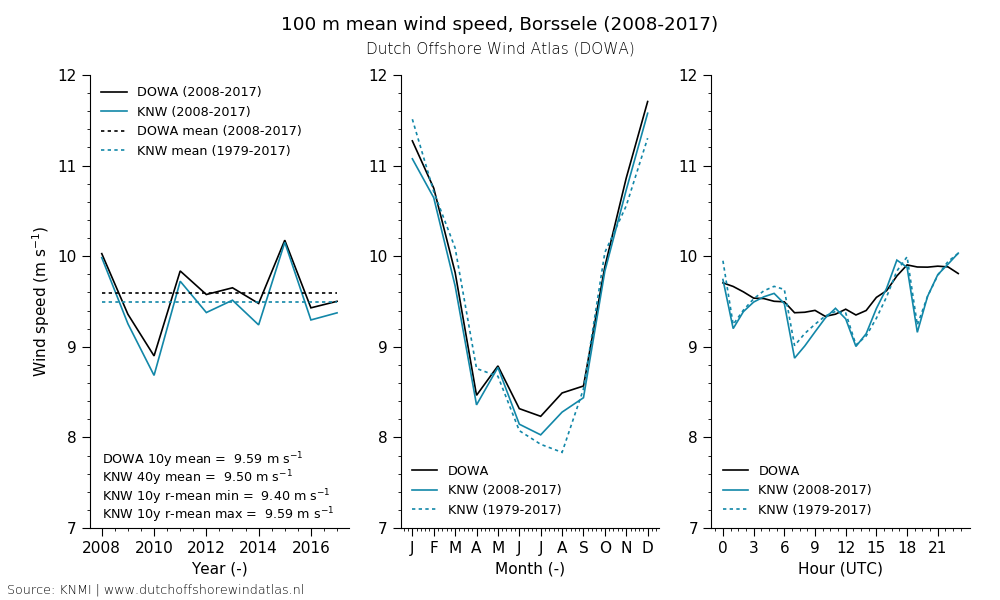
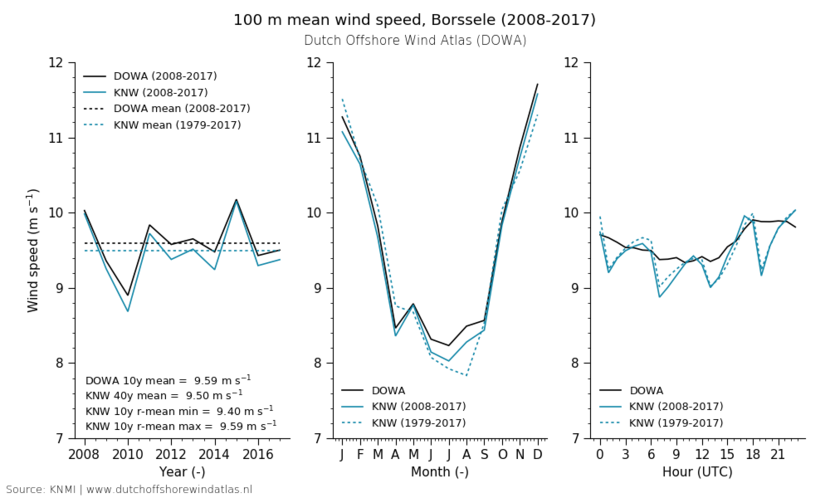
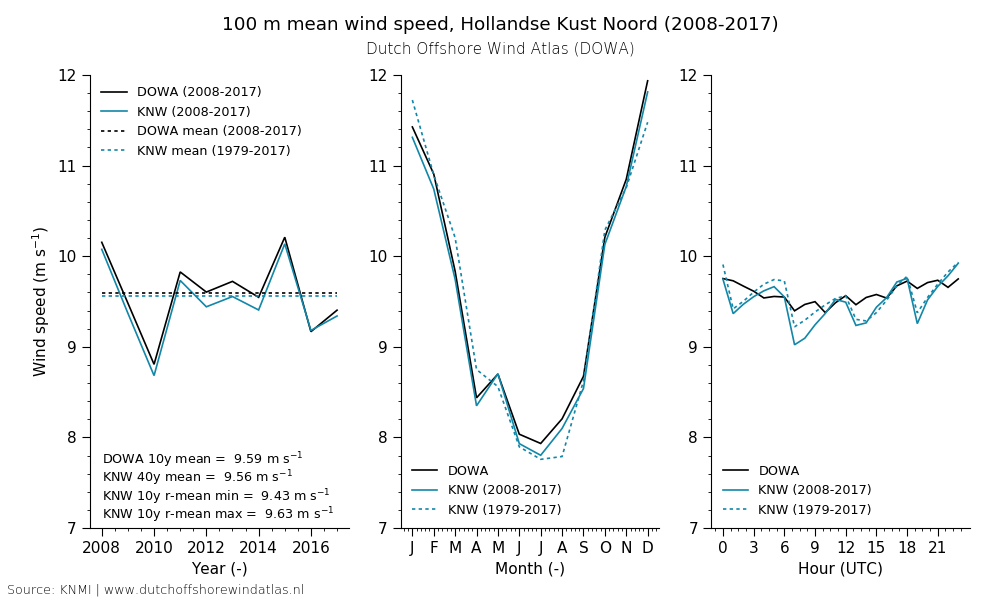
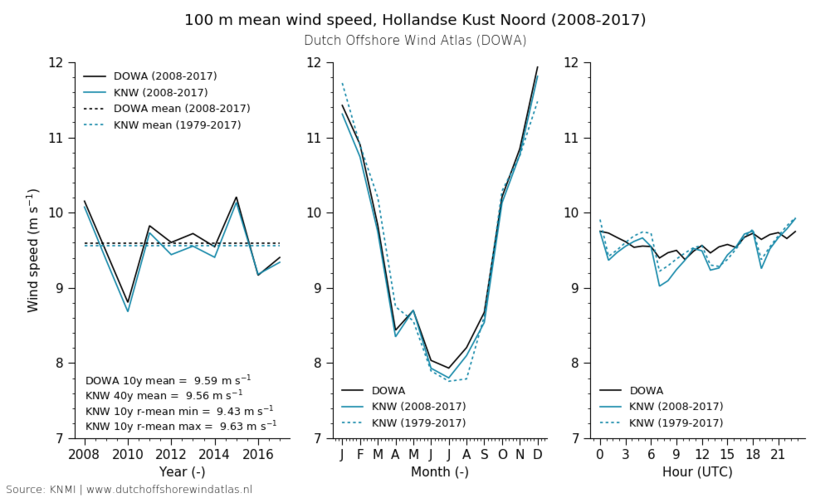
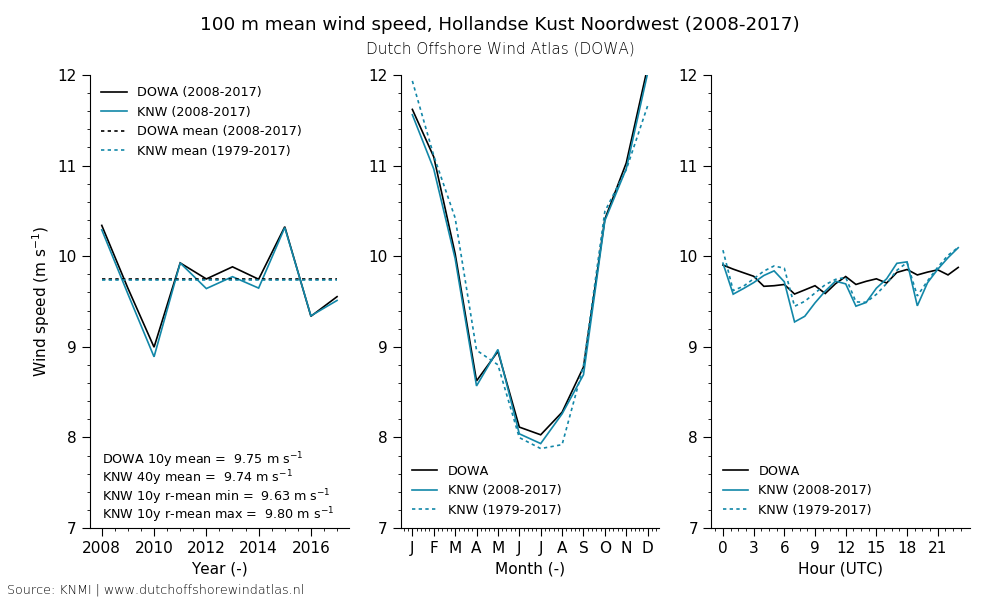


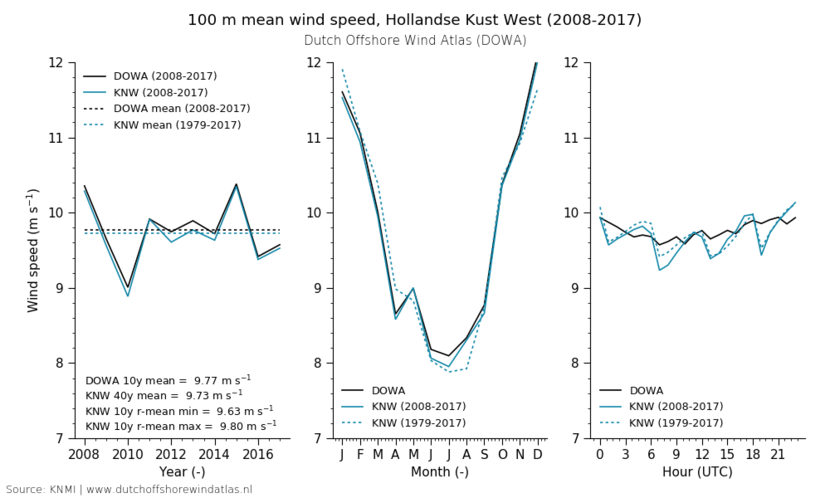
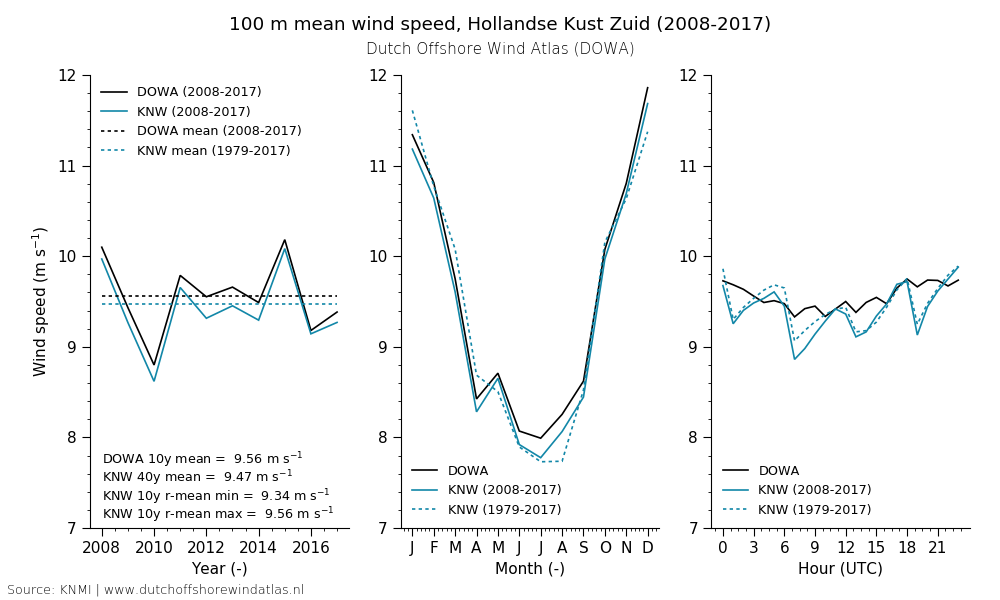
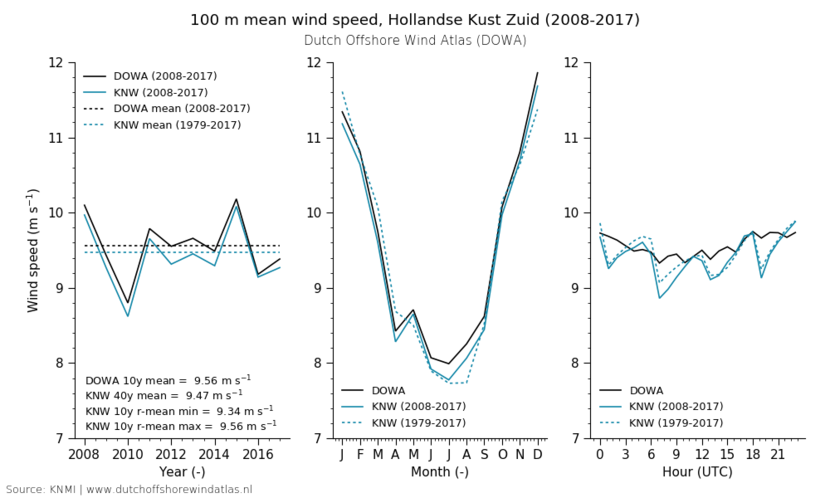
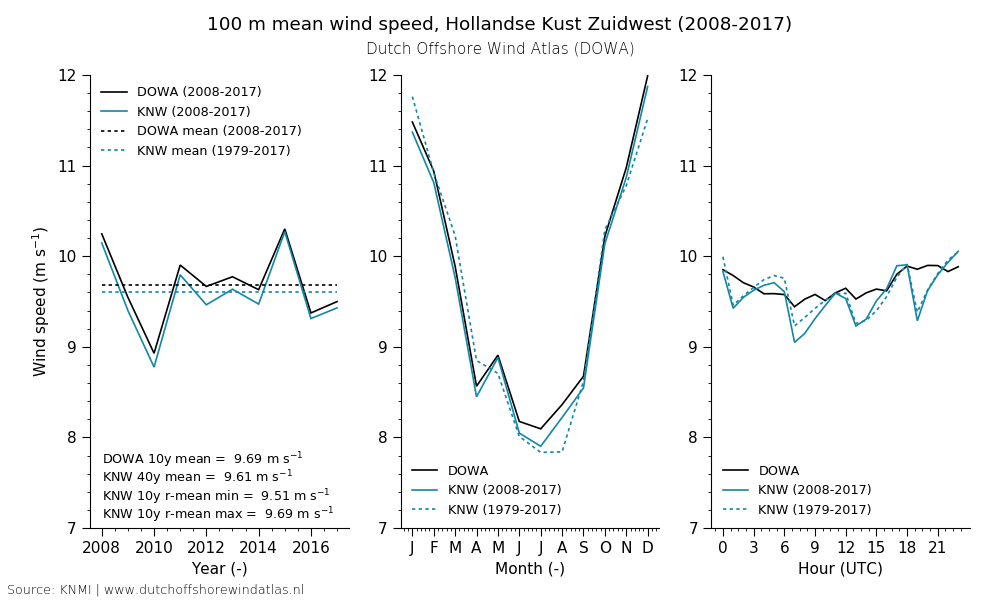

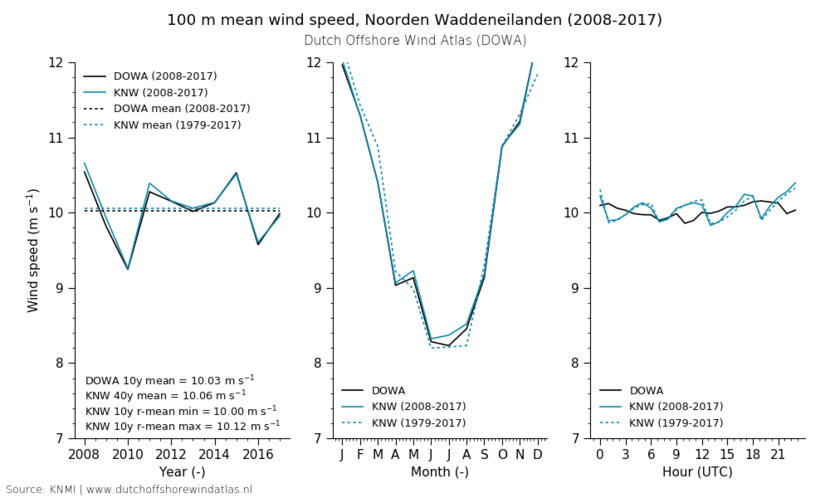
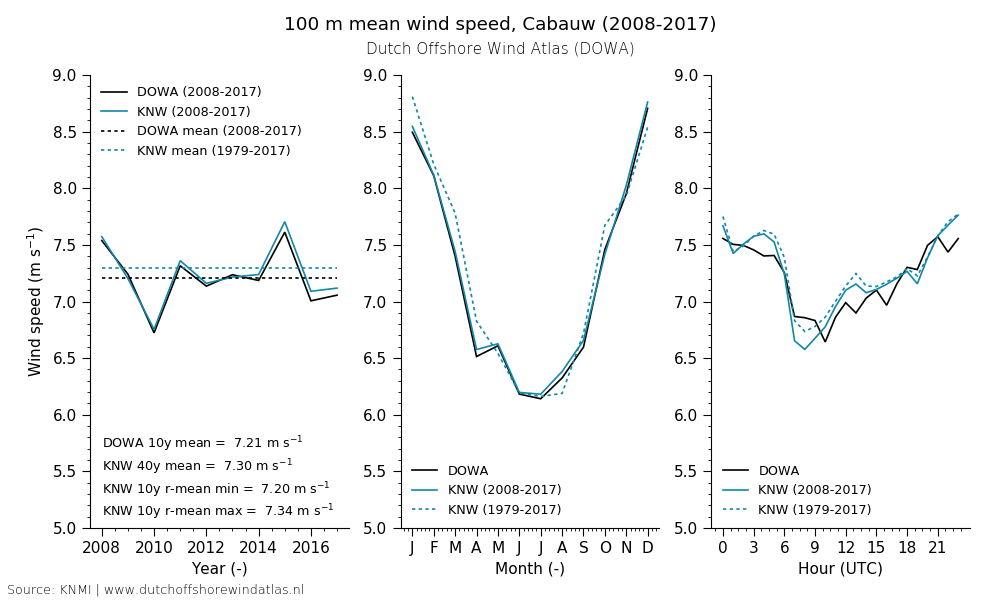
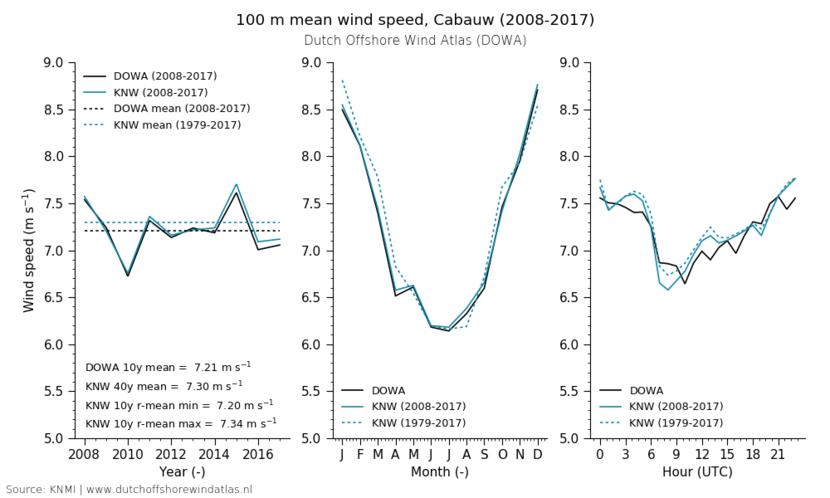
(left graph) Yearly and long-term averages
The yearly average wind speed based on the DOWA is presented in black and the one based on the KNW-atlas in blue. For all locations, the KNW-averages are slightly lower than the DOWA-averages, but the differences are within the uncertainty of the KNW-atlas (0.1 m/s at 100 m). The 10 year period between 2008-2017 seems to be fairy representable for the (39 year) climatological period covered by the KNW-atlas: for Borssele the difference between the long-term (39 year) average (9.5 m/s, indicated by the blue dashed line) and the 10-year average (9.59 m/s) is very small. The KNW maximum and the minimum 10 year running mean (r-mean) averages are also included in the figure. E.g: in the current climate the 10-year average wind speed at 100 m height at Cabauw is between 7.20 and 7.34 m/s .
(middle graph) 10-year monthly averages
The difference between the 10-year monthly average of the DOWA and the KNW-atlas is largest during the summer months (for all locations except Cabauw and Ten Noorden van de Wadden). This is a result of the shear correction that was applied in the KNW-atlas.
Note: Most state-of-the-art operational weather forecasting and climate models have problems with the representation of wind profiles in stable conditions because they overestimate the vertical mixing, i.e., they underestimate the increase of wind speed with height (KNMI TR342 by Wijnant et al, 2014).
Based on comparison with an 10 year average wind profile measured at Cabauw, it was found that ERA-Interim-HARMONIE underestimated the vertical wind shear by a factor of about 15% (or underestimating the wind speed at 100 m height by about 5%. A uniform shear correction of 15% was therefore applied for all locations, heights and time steps, making the profile more stable. This improved KNW’s validation results, both on land and offshore. However, for the generally more “unstable” summer months, the monthly averages figures show that making the atmosphere more stable (lower vertical mixing and increasing the shear) introduced an error. We do not see this effect in Cabauw because there stability is not seasonal (but diurnal). We also do not see this effect at Ten Noorden van de Wadden because the seasonal stability is less pronounced there:
- The seasonal variation of the Sea Surface Temperature (SST) has a lower amplitude there because the sea is deeper.
- The air temperature has more time to adapt to the SST for the warm wind directions in summer (southerlies) and the cold wind directions in winter (easterlies), because the fetch from land to the sea location is longer.
(right graph) 10-year average diurnal cycle
It was acknowledged in the “Validation of the KNW-atlas with publicly available mast observations” report that the KNW-atlas represented the diurnal cycle badly and the reason why was explained: “The diurnal variation graphs show an artefact of the model caused by the initialisation of the HARMONIE weather forecasting model at 0, 06, 12 and 18 UTC with the lower ERA-Interim wind speeds. It takes a number of hours into the forecast before HARMONIE develops more realistic, smaller structures and higher wind speeds than ERA-Interim is capable of. The forecast hours included in the wind atlas dataset (hours 1-6, with 0 being the initialisation time) were chosen to optimally match measurements made at KNMI measurement sites at the meteorological standard height of 10 m. Since then however, Wijnant et al (2015) have shown that using longer forecast lead times would probably improve agreement with satellite-based measurements of the wind above the North Sea. There is obviously a limit to this because there is a limit to how far ahead you can forecast accurately”.